
On this page
This Gutenberg performance comparison starts with a surprise: all three versions of my WordPress builder test earned a Lighthouse Performance score of 100.
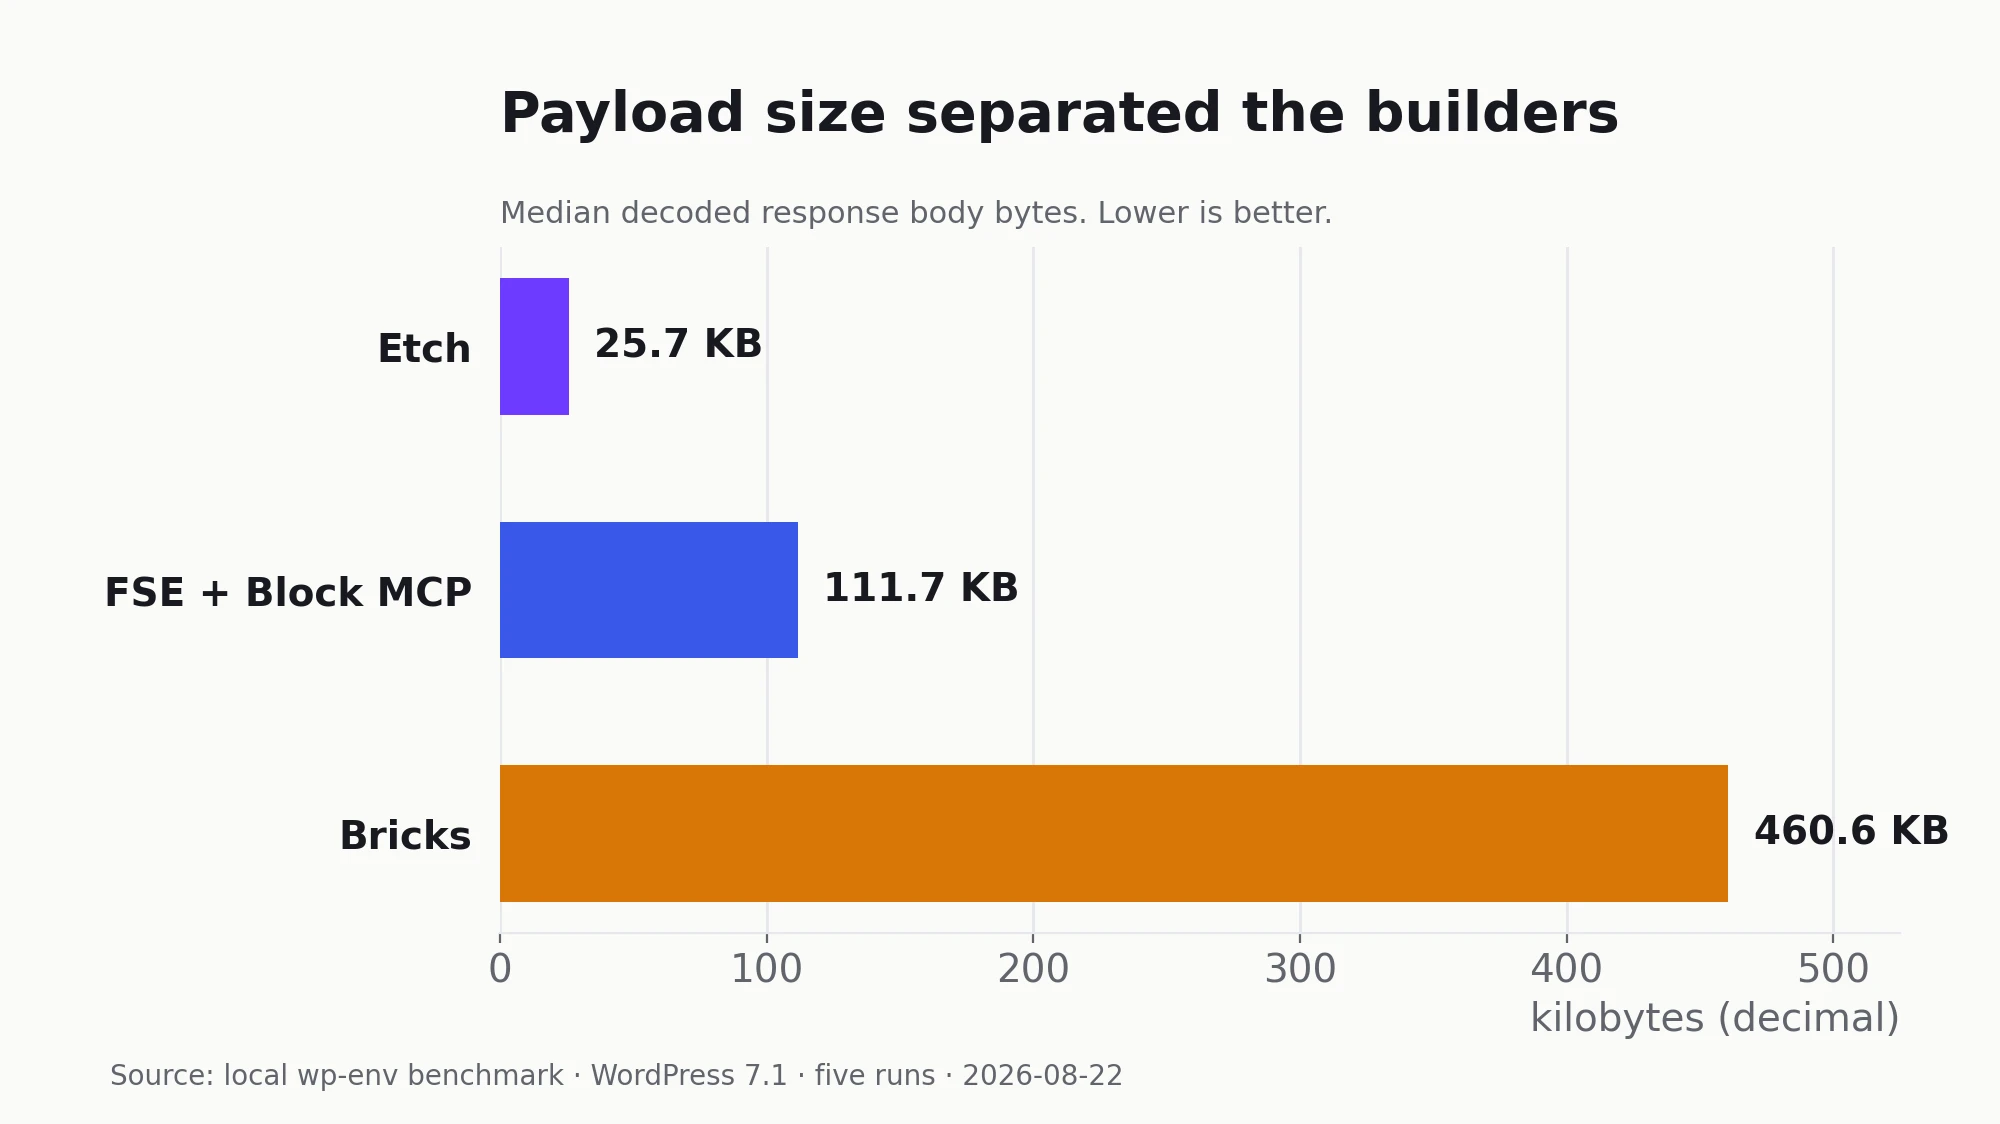
One produced 25.7 KB of decoded response bodies. Another produced 460.6 KB.
That is why the green score was the beginning of this comparison, not its conclusion.
I built the same landing-page brief natively in Etch, Bricks, and a pure FSE block theme. The implementations shared their copy, sections, palette, widths, responsive targets, and visual direction. They were not pixel-identical; each used its native layout and typography system.
Then I ran five fresh local audits per site using Chrome with no extra CPU or network throttling. The medians were remarkably stable.
Etch delivered the fastest LCP
| Stack | Median LCP | Five-run range |
|---|---|---|
| Etch | 657 ms | 654–667 ms |
| FSE + Block MCP | 753 ms | 753–754 ms |
| Bricks 2.4 beta | 1,356 ms | 1,355–1,362 ms |
Etch beat FSE by 96 milliseconds and Bricks by 699 milliseconds. Relative to Bricks, the measured Etch result was a 51.5% reduction in LCP.
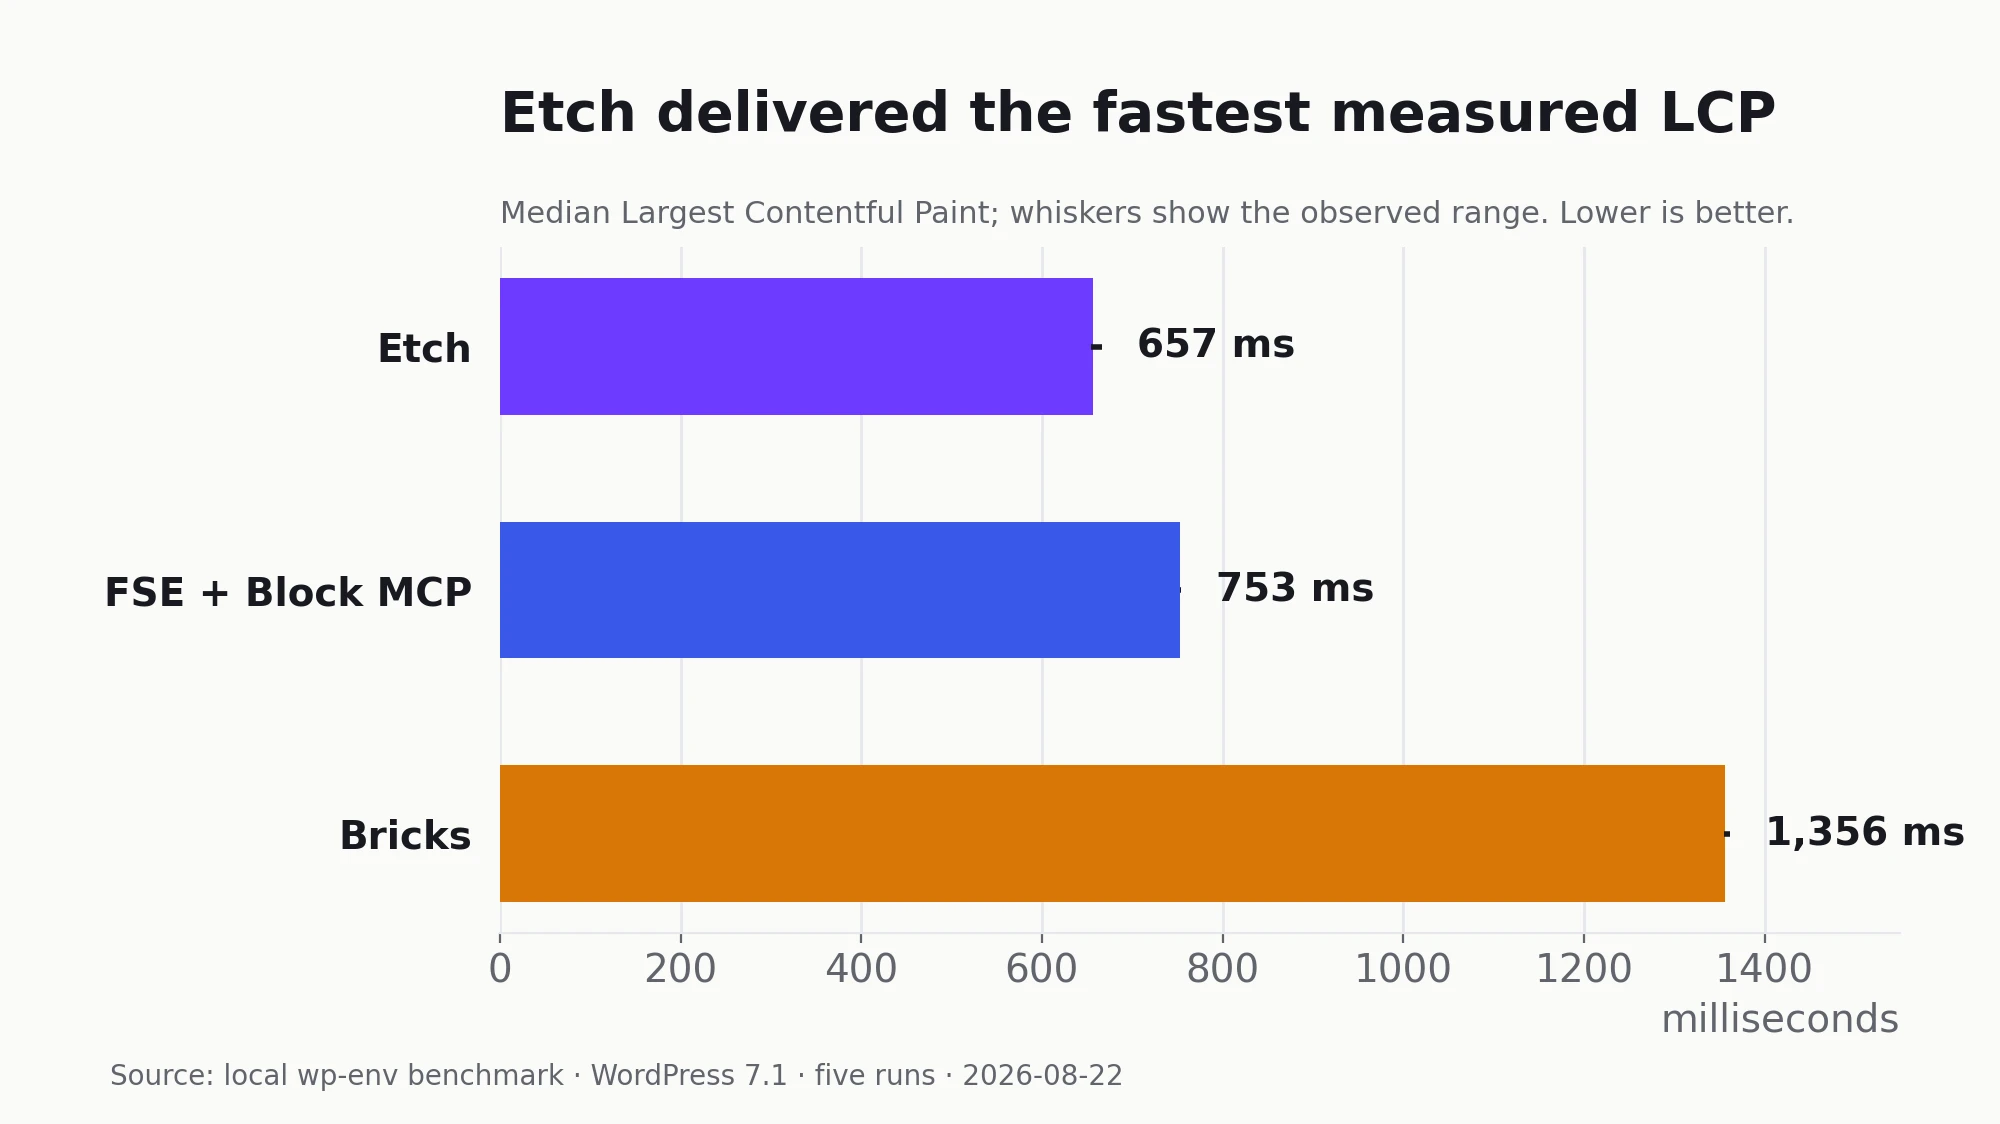
All three pages recorded zero CLS and zero TBT. First Contentful Paint equaled LCP. The separation did not come from one build visibly jumping around or blocking the main thread. It came from how much each stack asked the browser to receive and prepare.
The network surface explains more than the score
| Metric | Etch | FSE + Block MCP | Bricks |
|---|---|---|---|
| Browser requests | 2 | 4 | 7 |
| Raw HTML | 22,484 B | 56,569 B | 61,202 B |
| Decoded response bodies | 25,725 B | 111,667 B | 460,633 B |
| DOM elements | 127 | 138 | 125 |
| Maximum DOM depth | 9 | 12 | 9 |
Bricks actually produced the fewest DOM elements, so this is not a simplistic “builder wrapper bloat” story. Its native-class conversion kept the content tree disciplined. The weight came primarily from the broader Bricks frontend asset surface.
Etch produced the smallest HTML response and by far the smallest decoded response set. FSE landed between the two: more HTML and a deeper block-derived DOM than Etch, but a substantially smaller network surface than Bricks.
What a Bricks-to-Etch rebuild might improve
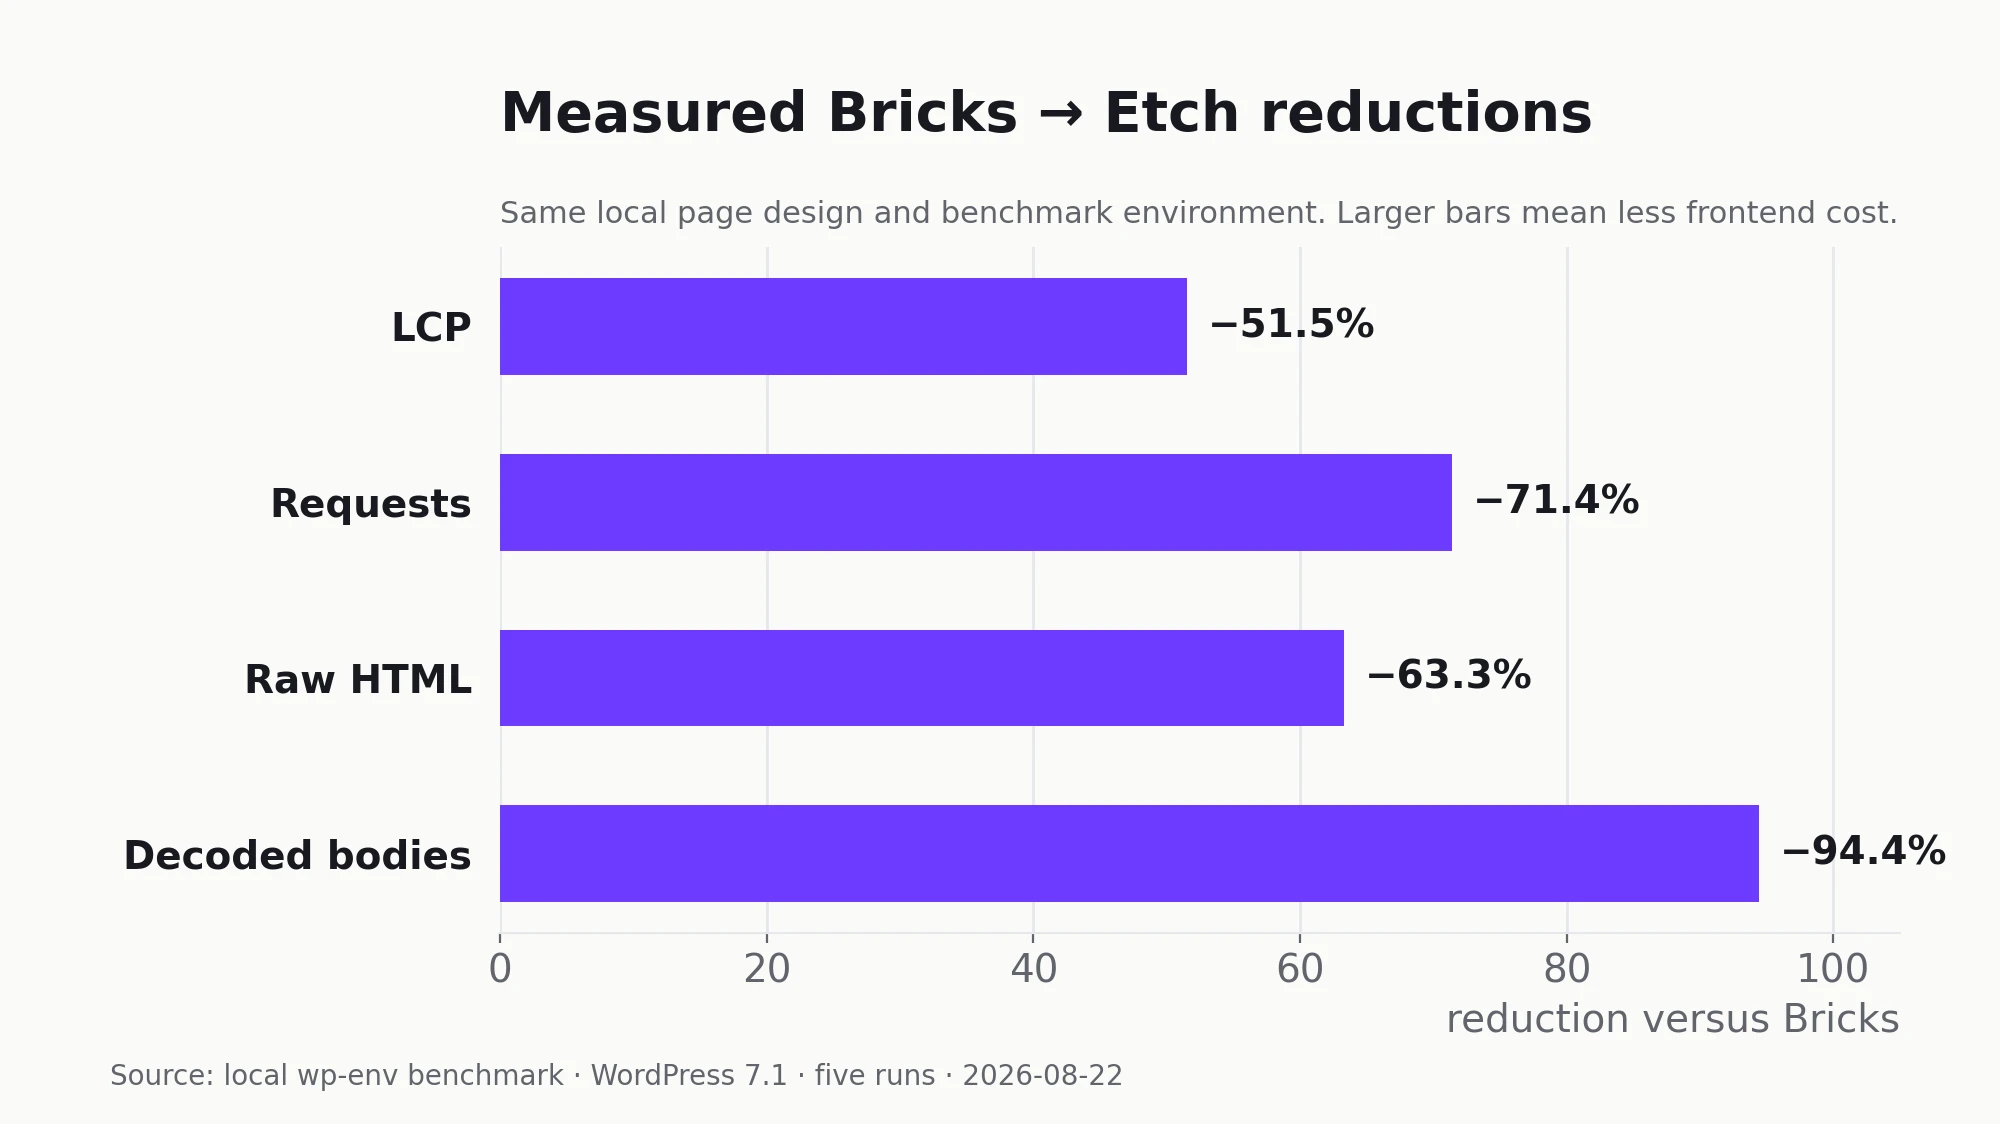
For this matched page, rebuilding natively in Etch changed the output by:
- 51.5% lower median LCP.
- 71.4% fewer requests.
- 63.3% less raw HTML.
- 94.4% fewer decoded response bytes.
- Four additional Lighthouse accessibility points.
Those are large enough to matter in a platform decision. They are not a forecast that every Bricks site will become exactly 699 milliseconds faster.
Real production pages have images, web fonts, analytics, forms, consent tools, caches, edge delivery, and database work. Any one of those can dominate LCP. A migration also has to preserve design and behavior; removing capability to improve a chart is not an improvement.
The responsible interpretation is narrower: in this controlled fixture, Etch imposed materially less frontend overhead than Bricks while delivering the same content and design complexity.
What happened when I turned on WP Rocket
I repeated the comparison with WP Rocket 3.23 mounted into all three wp-env sites. I verified a valid local license state, used WP Rocket’s supported debug override for localhost, primed each page twice, and confirmed that every stack produced and served a generated HTML cache file.
The strongest result was server-side. Across 50 requests per stack, warm full-page caching nearly eliminated WordPress generation time:
| Stack | Baseline median TTFB | WP Rocket median TTFB | Reduction |
|---|---|---|---|
| Bricks | 49.22 ms | 1.52 ms | 96.9% |
| Etch | 28.98 ms | 1.45 ms | 95.0% |
| FSE | 22.34 ms | 1.68 ms | 92.5% |
WP Rocket erased almost all of the server-generation difference: the three cached medians were separated by only 0.23 milliseconds. It did not erase the frontend difference. With default settings, request counts and transfer weights were effectively unchanged. The builder CSS, JavaScript, DOM, fonts, and media still had to reach and run in the browser.
A paired five-run Lighthouse pass made that boundary clear. Every baseline and cached run still scored 100 with zero TBT and CLS, but the local LCP medians moved by tens of milliseconds in inconsistent directions and the first-run ranges were much larger than those changes. I do not consider that evidence that WP Rocket made one builder’s LCP faster or slower. The defensible measured gain is the 20–48 milliseconds removed from local TTFB.
So does a cache erase Etch’s lead? It erases the PHP/WordPress portion, not the delivery architecture. On a well-cached site, frontend payload differences can become more—not less—important because server generation is no longer masking them.
WP Rocket does not provide fragment caching
WP Rocket’s documentation is explicit: it caches the entire rendered page as static HTML and does not support fragment caching. PHP-rendered dynamic fragments are frozen with the page until invalidation. Content that must change per request needs AJAX or client-side JavaScript, a separate uncached endpoint, or an excluded page.
That limitation applies equally to Bricks, Etch, and FSE. Their loop and component systems determine how the fragment is authored; the page-cache layer determines whether PHP executes for each request.
An SEO plugin equalizes metadata, not implementation quality
An SEO plugin would equalize the missing metadata in this fixture. Rank Math can generate a description from its templates, the excerpt, or the first suitable paragraph. The same configured plugin can supply canonical URLs, social metadata, schema, and XML sitemaps regardless of which system authored the page.
That does not make builder SEO irrelevant. An SEO plugin cannot repair a poor heading hierarchy, duplicate landmarks, inaccessible links, important content hidden behind client-side rendering, or excessive frontend work. The controlled 92/92/92 result says the missing meta description was shared; it does not say every possible implementation has identical search quality.
Why FSE remains a serious performance choice
FSE was only 96 milliseconds behind Etch locally. Its four requests and 111.7 KB decoded surface were larger, but still modest. Everything remained Core blocks, theme.json, templates, and theme CSS.
If long-term Core portability is the priority, the performance result does not disqualify FSE. It shows a close second rather than a compromised fallback.
Etch’s advantage becomes more persuasive when it aligns with its other strengths: direct agent mutations, strong design-system ergonomics, and a smaller output surface. Performance alone does not create the full recommendation.
SEO and accessibility were mostly a tie
The shared SEO result is explained in the metadata section above. Accessibility showed a similarly narrow spread.
Etch scored 94 for accessibility, while FSE and Bricks scored 90. All three had small contrast misses in secondary text. Etch also produced a nested footer landmark that should be corrected before production.
This is not evidence that one builder automatically guarantees SEO. The authoring stack can make semantic output easier or harder, but templates, content, metadata, and testing still determine the result.
Custom code can erase the builder-level performance gap
The benchmark did not include an embedded application, third-party API widget, custom query filter, or hand-written interaction bundle. That omission should be explicit.
A JSFiddle iframe, an unbounded API loop, or a copied JavaScript dependency can outweigh the builder’s own frontend payload. Conversely, rebuilding the same behavior with native elements, narrowly scoped styles, and conditional scripts can preserve much more of the underlying performance advantage.
The complete comparison contains the side-by-side capability matrix, while the AI-operability analysis explains why structured integration matters. A follow-up should compare the quickest working embed with a productionized version integrated into each platform’s components, query system, and asset loading.
The measurement I would run on a real site
Before migrating an existing site for speed, I would capture:
- Route-level RUM for LCP, INP, and CLS.
- Server timing and TTFB separately from browser work.
- LCP element identity on mobile and desktop.
- Request and byte breakdown by first-party builder assets, media, fonts, and third parties.
- Cold-cache and warm-cache results.
- Equivalent screenshots or visual-regression thresholds.
- Conversion and engagement baselines so performance can be connected to outcomes.
Synthetic testing tells us the stacks have different cost profiles. Production telemetry tells us whether changing that profile is worth the migration.
Disclosure: I may earn a commission if you purchase Etch through links in this article, at no additional cost to you.
This article is part of the WordPress AI Builder Test series. Start with I Built the Same WordPress Page With AI in Bricks, Etch, and Gutenberg, continue with the AI-operability comparison, then see the FSE-to-Etch migration and final stack decision.